SystemView
Note
This article mainly introduces the SystemView visual analysis tool and how to use it to debug and analyze the system on RT-Thread.
As MCU performance becomes stronger and stronger, the functions of embedded products become more and more complex, which poses new challenges to system debugging and analysis. Debugging a function or problem usually requires a lot of effort. SystemView is a powerful tool to help users debug and analyze the system, which can significantly shorten the development and debugging time and improve development efficiency. The purpose of this article is to help you use the SystemView tool on RT-Thread to debug and analyze the system.
The materials prepared for this article are as follows:
SystemView is a tool for online debugging of embedded systems. It can analyze which interrupts and tasks have been executed, as well as the order of execution of these interrupts and tasks. It can also view the time points when some kernel objects are held and released, such as semaphores, mutexes, events, message queues, etc. This is especially effective when developing and processing complex systems with multiple threads and events.
SystemView consists of two parts:
The PC program collects and displays the data from the embedded end, and can also save the data locally for later analysis.
Embedded program collects the operating data of the embedded system and transmits them to the PC through the RTT module of J-Link
Note
Because SystemView uses J-Link's RTT technology for data transmission, SystemView can only be used when the development board is connected with J-Link.
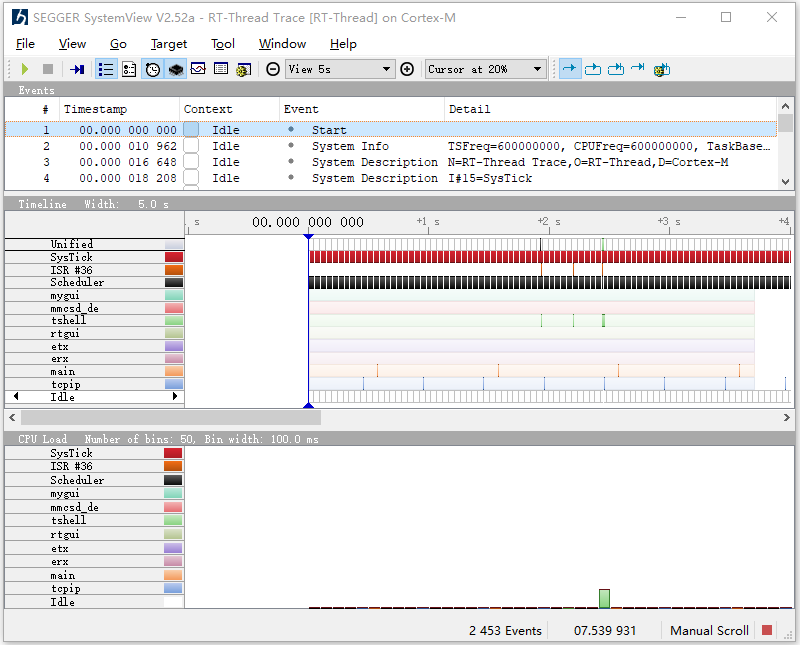
The SystemView software package provided by RT-Thread is the embedded end program implementation of the SystemView tool. Its main functions include: configuring the specific parameters of SYSTEMVIEW and RTT, collecting and formatting monitoring data, and sending the data to the PC through J-Link, etc. You only need to use the Env tool launched by RT-Thread to enable the SystemView software package and perform simple configuration on it to complete the configuration of the embedded end program of SystemView.
Take the Zhengdian Atom RT1052 development board as an example
Step 1: Enter the menuconfig graphical configuration tool in the Env tool
Open the Env tool, use the command cd D:\rt-thread\bsp\imxrt1052-evkto switch to the imxrt1052-evk directory in the root directory of the RT-Thread source code BSP, and then enter the command menuconfigto configure the project.
Note
menuconfig is a graphical configuration tool that RT-Thread uses to configure and tailor the entire system.
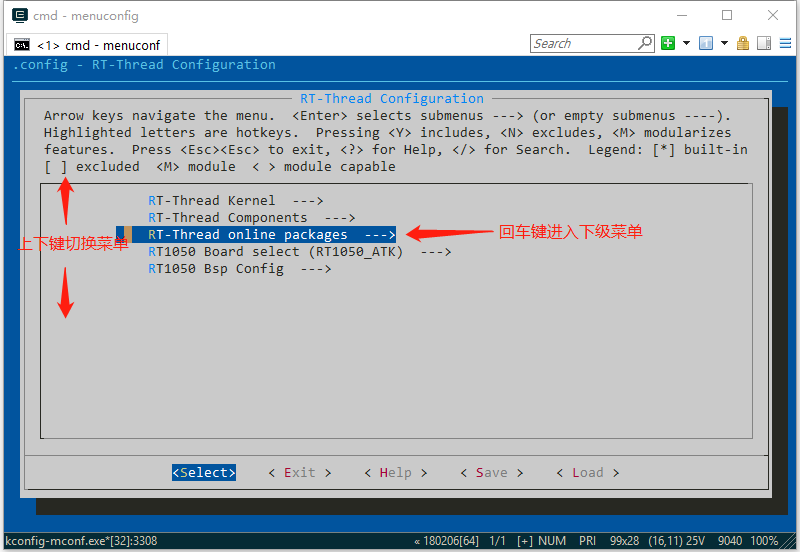
Step 2: Enable the SystemView software package.
Use the up and down keys to select RT-Thread online packages, press Enter to enter the sub-menu, and then open SystemView in tools packages.

Step 3: Specific configuration.
Press the Enter key to enter the sub-menu and make specific configurations (enter? to display specific information of the options).
The following are two commonly used options. Other options can be configured as needed (refer to the last part of the parameter directory):
(1) Change the option circled in red in the figure below to the kernel corresponding to your development board, such as the M7 kernel for i.MX-RT1052

(2) Enter the SystemView buffer configuration submenu and turn off post-analysis mode

After enabling post-analysis mode, you need to call the function SEGGER_SYSVIEW_Start() in the project to start recording. System events will be continuously recorded and old events will be overwritten when the buffer is full. Therefore, when reading the buffer, only the latest events can be read.
Note
Post-mortem analysis can be useful when a system has been running for a long time and suddenly crashes. In this case, the most recent events can be read from the buffer in the target and SystemView can show what happened just before the system crashed.
After turning off the post-analysis mode, you will be in continuous recording mode. You can control the start and end of recording on the PC to continuously record the operation of the system. To analyze the operation of the following demo, you need to turn on the continuous recording mode.
After configuring the options, press ESC to return, exit and save the configuration. The enabling and related configuration of the SystemView software package is now complete.
Later we will use a specific demo to explain the use of the SystemView tool
Add the following code to the file main.c, and then call the demo initialization function in the main function demo_init();to run the demo.
Step 1: Download SystemView analysis tool download link
Step 2: Add a system description file for RT-Thread
First, find the packages directory under the development board directory, and then find the segger_debug-xxx directory under the packages directory. There is a SystemView_Description folder in this directory, and the description file of the RT-Thread system is in it. The specific directory structure is as follows:
bsp\\你自己的开发板\\packages\\segger_debug-xxx\\SystemView_Description\\SYSVIEW_RT-Thread.txt
Copy this file to the Description directory under the SystemView tool installation directory so that SystemView can recognize the RT-Thread system.
Step 3: Configure device information and start recording
Double-click to open the SystemView PC program. Below is an introduction to the functions of some commonly used buttons on the main interface.

When in continuous recording mode, click the Start Recording button and a window will pop up to configure the device information.
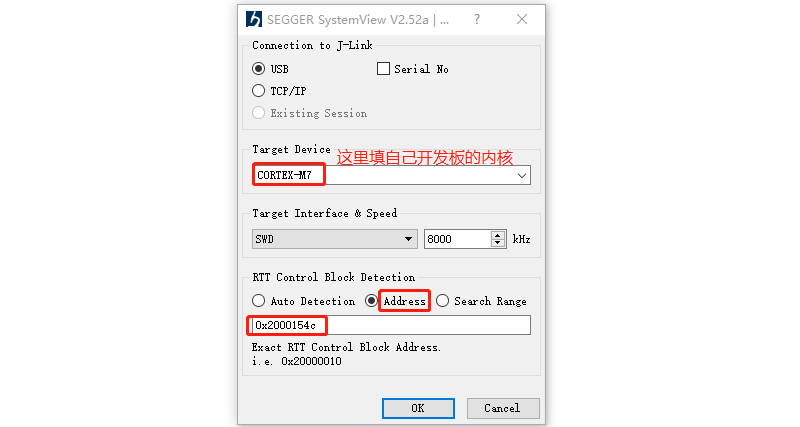
The address of the RTT control block in the figure has been printed out through the serial port. Just open the terminal software and copy the printed address above.

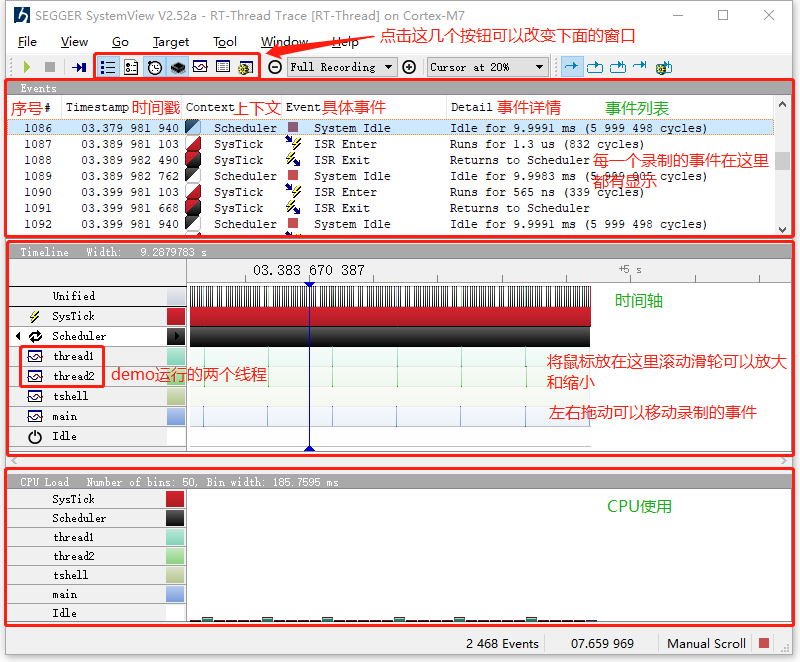
Click OK. Now SystemView starts recording system information in real time. Below is the real-time operation status of the system.
Step 4: End recording and analyze the system
Click the End Recording button to end the recording. Place the mouse in the timeline window and use the scroll wheel to zoom in on the event to a size suitable for analysis.
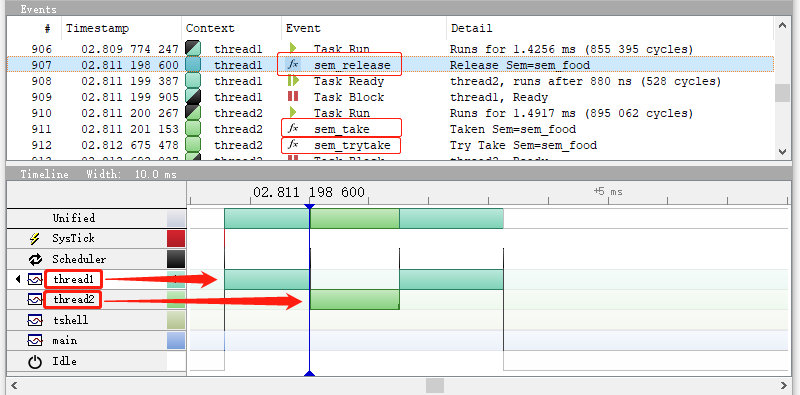
Using the SystemView tool, we can see that the system is running as we expected. Thread 1 starts running first, and then is interrupted by Thread 2 after releasing the semaphore. Thread 2 then runs, and then is suspended because it cannot obtain the semaphore, and Thread 1 continues to run. From the above event list, we can also see the specific time when each thread obtains or releases the semaphore.
Note
If the post-analysis mode is turned on, you cannot click the Start Recording button. Instead, you need to click the Read Recorded Data button. Other operations are the same as in the real-time analysis mode.
After reading this document, I believe you have learned how to use the SystemView analysis tool on RT-Thread.
parameter
describe
App name
Application Name
Device name
The kernel used by the device
Timestap frequency
Timestamp frequency (0 means using the system default frequency)
cpu freq
CPU frequency (0 means using the system default frequency)
RAM base
RAM base address default value: 0x2000 0000
Event ID offset
Event ID offset default value: 32
Using the Cortex-M cycle ...
Use system frequency as timestamp
System description 0-2
System descriptor "I#num=name, ..." num is the interrupt number, name is the interrupt name
parameter
describe
Max number of up buffer
Maximum number of RTT output buffers Default value: 2
Max num of dowm buffer
Maximum number of RTT input buffers Default value: 2
buffer size up
The number of bytes used for the RTT terminal output channel. Default value: 1024 bytes
buffer size down
The number of bytes used for the RTT terminal input channel. Default value: 16 bytes
Segger RTT printf buffer size
Buffer size when sending character blocks via RTT printf Default value: 64
Mode for pre-initialized terminal channel
Pre-initial RTT terminal channel mode default value: NO_BLOCK_SKIP
Max Interrupt priority
Maximum interrupt priority level
Use RTT ASM
Using the assembly version of RTT
memcpy uses byte-loop
Use a simple byte-loop instead of memcpy
parameter
describe
RTT buffer size
The number of bytes used by SystemView to record the buffer
RTT channel
The RTT channel is used for SystemView event logging and communication. 0 means automatic selection
Use static buffer
Using static buffer can save space
Enable post mortem analysis mode
Enable post-mortem mode
parameter
describe
ID Base
The value subtracted from the ID documented in the SystemView package Default value: 0x1000 0000
ID Shift
The number of digits in the ID offset documented in the SystemView package. Default value: 2
Last updated
Was this helpful?